
Soft wheat flour
Food, Plant source foods, Flours
Consumption area(s) (countries that consumed more than 45 kg per person per year of wheat flour and its derivatives in 2022): Afghanistan 🇦🇫, Albania 🇦🇱, Algeria 🇩🇿, Andorra 🇦🇩, Antigua and Barbuda 🇦🇬, Argentina 🇦🇷, Armenia 🇦🇲, Australia 🇦🇺, Austria 🇦🇹, Bahamas 🇧🇸, Bahrain 🇧🇭, Barbados 🇧🇧, Belarus 🇧🇾, Belgium 🇧🇪, Belize 🇧🇿, Bolivia 🇧🇴, Bosnia and Herzegovina 🇧🇦, Botswana 🇧🇼, Brazil 🇧🇷, Bulgaria 🇧🇬, Canada 🇨🇦, Cape Verde 🇨🇻, Chile 🇨🇱, China 🇨🇳, Croatia 🇭🇷, Cuba 🇨🇺, Cyprus 🇨🇾, Czech Republic 🇨🇿, Denmark 🇩🇰, Djibouti 🇩🇯, Ecuador 🇪🇨, Egypt 🇪🇬, Equatorial Guinea 🇬🇶, Estonia 🇪🇪, Fiji 🇫🇯, Finland 🇫🇮, France 🇫🇷, Gabon 🇬🇦, Georgia 🇬🇪, Germany 🇩🇪, Greece 🇬🇷, Guyana 🇬🇾, Hungary 🇭🇺, Iceland 🇮🇸, India 🇮🇳, Iran 🇮🇷, Iraq 🇮🇶, Ireland 🇮🇪, Israel 🇮🇱, Italy 🇮🇹, Jamaica 🇯🇲, Japan 🇯🇵, Jordan 🇯🇴, Kazakhstan 🇰🇿, Kuwait 🇰🇼, Kyrgyzstan 🇰🇬, Latvia 🇱🇻, Lebanon 🇱🇧, Libya 🇱🇾, Liechtenstein 🇱🇮, Lithuania 🇱🇹, Luxembourg 🇱🇺, Maldives 🇲🇻, Malta 🇲🇹, Marshall Islands 🇲🇭, Mauritania 🇲🇷, Mauritius 🇲🇺, Moldova 🇲🇩, Monaco 🇲🇨, Mongolia 🇲🇳, Montenegro 🇲🇪, Morocco 🇲🇦, Namibia 🇳🇦, Nauru 🇳🇷, Nepal 🇳🇵, Netherlands 🇳🇱, New Zealand 🇳🇿, North Korea 🇰🇵, North Macedonia 🇲🇰, Norway 🇳🇴, Pakistan 🇵🇰, Palestine 🇵🇸, Panama 🇵🇦, Paraguay 🇵🇾, Peru 🇵🇪, Poland 🇵🇱, Portugal 🇵🇹, Qatar 🇶🇦, Republic of the Congo 🇨🇬, Romania 🇷🇴, Russia 🇷🇺, Saint Kitts and Nevis 🇰🇳, Saint Lucia 🇱🇨, Saint Vincent and the Grenadines 🇻🇨, Samoa 🇼🇸, San Marino 🇸🇲, São Tomé and Príncipe 🇸🇹, Saudi Arabia 🇸🇦, Serbia 🇷🇸, Seychelles 🇸🇨, Slovakia 🇸🇰, Slovenia 🇸🇮, South Africa 🇿🇦, South Korea 🇰🇷, Spain 🇪🇸, Sri Lanka 🇱🇰, Sudan 🇸🇩, Suriname 🇸🇷, Sweden 🇸🇪, Switzerland 🇨🇭, Syria 🇸🇾, Tajikistan 🇹🇯, Tonga 🇹🇴, Trinidad and Tobago 🇹🇹, Tunisia 🇹🇳, Turkey 🇹🇷, Turkmenistan 🇹🇲, Tuvalu 🇹🇻, Ukraine 🇺🇦, United Arab Emirates 🇦🇪, United Kingdom 🇬🇧, United States of America 🇺🇸, Uruguay 🇺🇾, Uzbekistan 🇺🇿, Vanuatu 🇻🇺, Yemen 🇾🇪, Vatican City 🇻🇦
Introduction
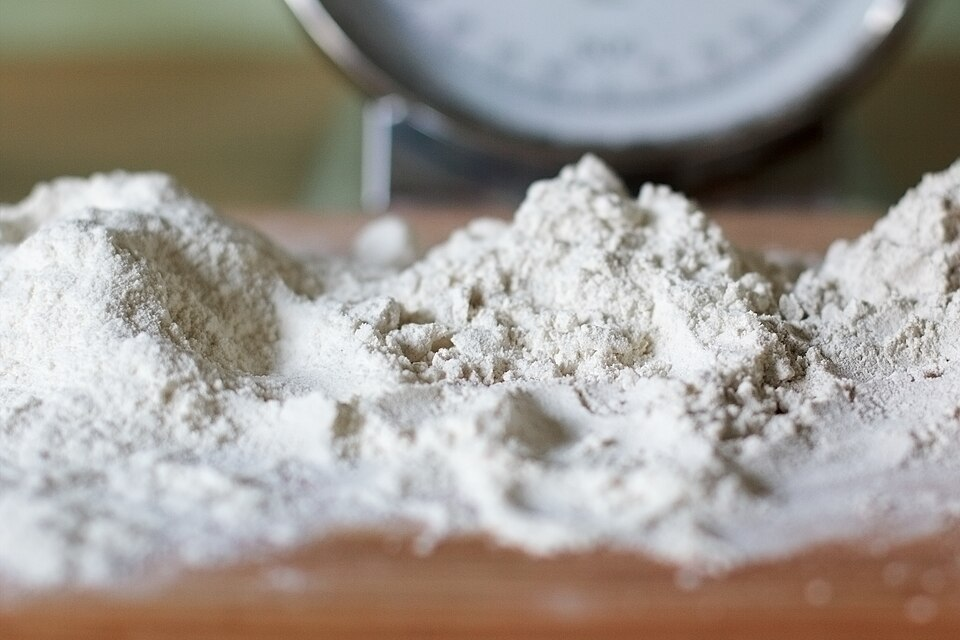
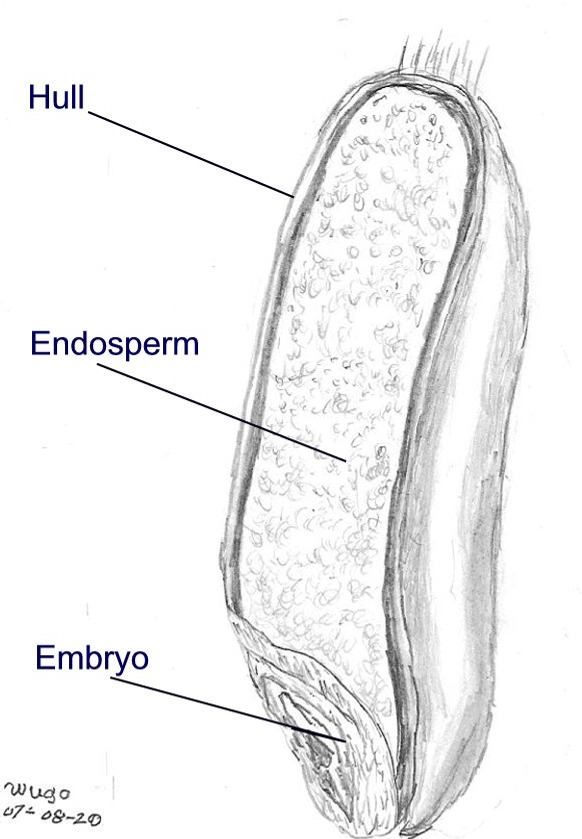
Soft wheat flour is a type of flour obtained by grinding the dried kernels of soft wheat (Triticum aestivum). Each kernel is composed mainly of three parts: the endosperm, rich in proteins and starches; the germ, which contains proteins, lipids, and vitamins; and the bran, abundant in fibers.
However, grinding the whole grain, including all three components, is carried out only to produce a specific kind of flour known worldwide as whole wheat flour. In all other cases, the process yields flours that contain almost exclusively the endosperm, or flours with variable proportions of germ and bran.
Description of soft wheat flour
An essential factor when selecting a specific type of flour for culinary use is its protein content. In soft wheat flour, the predominant proteins are gliadins and glutenins, which, when combined with water and exposed to mechanical energy, develop gluten. This gluten network is critical for providing strength to doughs (a concept we will explore further). As a result, a dough made from high-protein flour tends to be more elastic and resilient, whereas one prepared with low-protein flour is softer, lighter, and less structured.
The protein percentage along with the amounts of bran and germ present in the flour represent the two main criteria used worldwide to classify this ingredient (as will be discussed in more detail later). It is important to note, however, that these factors are interconnected but not directly dependent on one another. Reducing the bran and germ content can lower the overall protein level, since a portion of proteins resides in these components. Yet, the protein content is also influenced by the wheat variety and growing conditions.
Therefore, wheat that naturally contains a high proportion of gliadins and glutenins and is cultivated under optimal conditions can yield protein-rich flours, even when the endosperm constitutes the majority of the grain.
History of soft wheat flour
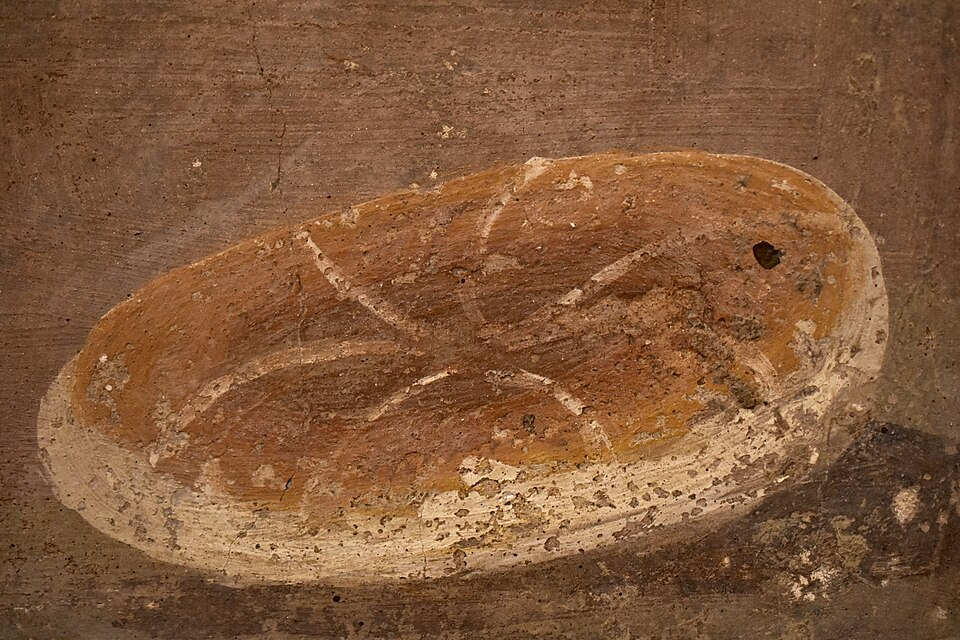
The processing of seeds to produce flour dates back at least to 6000 BCE, as evidenced by archaeological findings of primitive grinding stones. More recent discoveries, such as those from 2018 at Shubayqa 1, a Natufian site in northwestern Jordan, suggest that bread was being made more than 14,000 years ago. Later, the Romans introduced innovations like the conical mill, while the industrial era marked a major turning point with the advent of the steam-powered mill, exemplified by the Albion Mills in London in 1786.
One of the major challenges in the 19th century was the preservation of flour, which at the time was still almost entirely whole grain. The fatty acids present in the germ limited its shelf life, as exposure to oxygen during milling triggered oxidation, causing the flour to become rancid within six to nine months. This period was too short for the industrial production and distribution cycle, leading to the adoption of degerminated flour—now far more common than whole wheat flour.
Degermination, which involves the removal of the germ, initially spread in urban centers and later reached rural areas. Although this process removed some nutritional components, it significantly improved the shelf life of the product. At the same time, a thermal treatment technique for the germ was developed, allowing it to be separated from the endosperm and bran, treated with steam, dry heat, or microwaves, and then reintegrated into the flour, enabling the industrial sale of whole wheat flour as well.
Production methods for soft wheat flour
The milling process of soft wheat begins with thorough cleaning, which occurs in multiple stages. The first step, known as pre-cleaning, takes place upon receiving the grain and serves to remove coarse impurities, helping to maintain the quality of the grain during storage in silos. The subsequent primary cleaning stage employs various machines to eliminate specific contaminants, including the grain brush, which deeply cleans the surface of each kernel, removing dust, soil, and mold.
Before milling, the grain undergoes a tempering and conditioning process. This step softens the bran, making it easier to separate during sieving. After a resting period, a second cleaning is often performed to further improve the grain quality.
Milling itself starts with a series of break rollers, which replace the traditional stone mills. These rollers crush the grain and allow it to be sifted, separating the fine white flour particles from the coarser residues. The coarse particles may consist of bran and germ, while intermediate fractions are primarily endosperm. These fractions can undergo additional processing. The flour is repeatedly passed through reduction rollers, with sieving after each pass, in order to maximize the extraction of white flour while removing the bran and germ particles until the desired fineness is achieved.
For the production of whole wheat flour, it is necessary to reintroduce the entire bran and germ that were separated during milling. These components are ground separately, often in a pin mill, to obtain finer fractions. The endosperm is then recombined with these fractions, producing whole wheat flour composed entirely of the original grain.
The resulting flours can also be fortified with additives to enhance certain properties, keeping in mind that regulations regarding which additives are allowed or prohibited typically vary by country.
Determination of Baking Quality Factor
The most important characteristic of flour is its baking quality factor, often referred to as “Strength”, which indicates the flour’s ability to maintain stability and resist throughout the entire processing and dough handling stages. To evaluate this property, the Chopin Alveograph is used, following a standardized procedure:
- First, a dough is prepared using 250 g of flour and slightly salted water, mixed for eight minutes. The amount of water added corresponds to 50% of the flour’s weight, taking into account the moisture naturally present in the flour.
- The dough is then divided into five small round pieces, or “patties,” which are allowed to rest for 15 minutes at 25°C.
- Next, the patties are placed on a plate where they are inflated by a controlled air pressure flow, forming semi-spherical shapes.
During this process, a graph is generated: the vertical axis represents the pressure applied beneath the dough, while the horizontal axis shows the bubble expansion. The maximum pressure, denoted as P, reflects the tenacity of the dough, expressed in millimeters of water. As the bubble continues to expand, microfractures reduce the pressure required for further inflation. When the bubble reaches dimension L, it bursts, and L is defined as the extensibility of the dough.
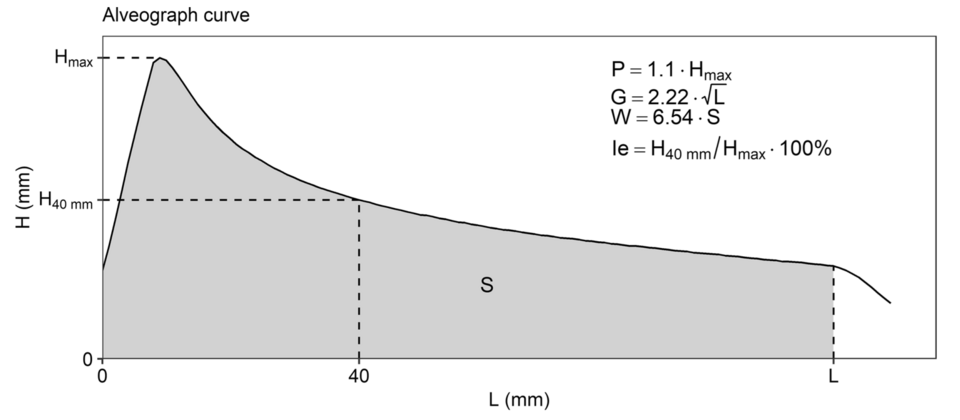
The Strength (W) is calculated as the area under the curve of this graph. When the bubble size is measured in millimeters, W represents the energy needed to inflate the dough until rupture, measured in ten-thousandths of a joule (10⁻⁴ J).
This property depends primarily on the amount of gliadins and glutenins present in the flour and their ability to form gluten when mixed with water and mechanical energy. Because Strength is closely linked to protein content, it can be estimated using a conversion table from the protein percentage listed in the nutritional information, even though W values are rarely indicated on commercial packaging.
| Protein Content (g of protein per 100 g of flour) | Strenght (W) | Common Name |
| 9-10 | 90-160 | Weak flour |
| 10-12,5 | 160-250 | Medium strenght flour |
| 14 | over 300 | Strong flour |
It is important to note that weak flours are typically used in applications where a light, tender texture is desired, such as in cakes, cookies, or as a thickening agent for sauces. Medium-strength flours are suited for doughs that require moderate elasticity and resistance, including pizza, focaccia, and baguettes. In contrast, strong flours are necessary for doughs that demand high tenacity and durability, such as bread, and brioche.
A widely used classification, similar in concept but applied to wheat rather than flour, is the Synthetic Quality Index (ISQ). This index allows wheat varieties to be categorized into five groups based on their strength, which is closely related to their protein content.
| ISQ | Strenght (W) | Proteins |
| Strength wheats (FF) | >14 | >300 |
| Superior breadmaking wheat (FPS) | 13-14 | 220-300 |
| Bread wheat (FP) | 11-13 | 160-220 |
| Baking wheats (FB) | <11 | <160 |
| Wheats for Other Uses (FAU) | Not included in the previous values | Not included in the previous values |
Classification of soft wheat flour
The classification of soft wheat flours is perhaps the most complex and debated topic in this entire discussion, as there is still no universally recognized system, either globally or continentally, and many countries continue to adopt their own standards. In general terms, however, two main criteria are used for classification: the protein percentage and the relative proportion of endosperm, germ, and bran within the flour.
The first system, used primarily in English-speaking countries such as the United States, Canada, and the United Kingdom, is based on assigning common names—usually related to the type of preparation the flour is best suited for—to flours that fall within a specific protein range.
The second system, more widespread across Europe, is based on an empirical measurement: the ash content, determined by burning a sample of flour in laboratory furnaces and measuring the residual ashes. Since these ashes mainly consist of mineral salts, which are concentrated in the bran and germ, a high ash percentage indicates a flour with a higher content of bran and germ—thus closer to whole wheat flour. Conversely, a low ash percentage reflects a flour made almost entirely from endosperm, producing a lighter and more refined product.
Although these two classification systems may appear fundamentally distinct, they can be compared and correlated by considering that there is usually a relationship between the protein content and the proportion of the three main components of the wheat grain (as discussed above). In fact, even when a country classifies flour solely by protein percentage, it is possible to construct conversion tables (as shown below) that estimate the ash content, even though this value is not typically indicated on commercial packaging. Such tables allow for an approximate comparison with systems based on ash percentage.
Conversely, inferring protein content from ash percentage is generally easier, since protein values are always provided in the nutritional tables printed on flour packaging.
Below are listed some of the different classification systems used for soft wheat flours in various countries. (This section is intended to be gradually expanded as additional systems are explored.) To compare two classification systems, one simply needs to identify either the ash or protein percentage in one system and look for a flour with similar values in the other. However, it is recommended to compare proteins with proteins and ashes with ashes whenever possible, as this yields more precise results. In the absence of corresponding data, it is still possible to cross-compare ashes and proteins, though with a lower degree of accuracy.
Here is a list of the countries for which the national classification is currently available:
- Argentina 🇦🇷/Perù 🇵🇪/Paraguay 🇵🇾/Uruguay 🇺🇾
- Australia 🇦🇺
- Austria 🇦🇹
- Brazil 🇧🇷
- Canada 🇨🇦
- China 🇨🇳
- France 🇫🇷/Portugal 🇵🇹/Monaco 🇲🇨
- Germany 🇩🇪
- India 🇮🇳
- Italy 🇮🇹/San Marino 🇸🇲/Vatican City 🇻🇦
- Japan 🇯🇵
- Poland 🇵🇱
- South Africa 🇿🇦
- Switzerland 🇨🇭/Liechtenstein 🇱🇮
- United Kingdoms 🇬🇧/Ireland 🇮🇪
- United States of America 🇺🇸
Moreover, soft wheat flours can also be classified according to the wheat cultivars from which they are derived, regardless of the milling process. Among the various cultivars, we find:
- Bilancia soft wheat flour
- Bolero soft wheat flour
- Centauro soft wheat flour
- Marzotto soft wheat flour
- Mec soft wheat flour
- Mieti soft wheat flour
- Pandas soft wheat flour
- Serio soft wheat flour
- Verna soft wheat flour
Argentina 🇦🇷/Perù 🇵🇪/Paraguay 🇵🇾/Uruguay 🇺🇾
| Name | Protein content (%) | Ash content (%) |
| 0000 | <9 | 0.4 ca. |
| 000 | 10-11 | 0.55 ca. |
| 00 | 12 | 0.8 ca. |
| 0 | >12 | 1.1 ca. |
| Integral | 13 | >1.5 |
Australia 🇦🇺
| Name | Protein content (%) | Ash content (%) |
| Plain flour | 11 ca. | 0.55 ca. |
| Hard flour | 14 ca. | 0.8 ca. |
| Whole Wheat | 13 ca. | >1.5 |
Austria 🇦🇹
| Name | Protein content (%) | Ash content (%) |
| W480 | 9 ca. | 0.33-0.8 |
| W700 | 11 ca. | 0.66-0.79 |
| W1600 | 15 ca. | 1.5.-1.75 |
| Weizen-Vollkornmehl | 13 ca. | >1.75 |
Brazil 🇧🇷
| Name | Protein content (%) | Ash content (%) |
| 1 | 7.5 | 0.8 |
| 2 | 8 | 1.4 |
| Integral | 8 | 2.5 |
Canada 🇨🇦
| Name | Protein content (%) | Ash content (%) |
| Cake and pastry flour | 6-9 | 0.35-0.5 |
| All purpose flour | 10-14 | 0.55-0.8 |
| Wholemeal flour | 13 ca. | >1.5 |
China 🇨🇳
| Name | Protein content (%) | Ash content (%) |
| 低筋麵粉 (Dījīn miànfěn) | 9 ca. | 0.4 ca. |
| 中筋麵粉 (Zhōngjīn miànfěn) | 11 ca. | 0.55 ca. |
| 高筋麵粉 (Gāojīn miànfěn) | 14. ca. | 0.8 ca. |
| 特高筋麵粉 (Tè gāojīn miànfěn) | 15 ca. | 1.1 ca. |
| 全麥麵粉 (Quánmài miànfěn) | 13 ca. | >1.5 |
France 🇫🇷/Portugal 🇵🇹/Monaco 🇲🇨
| Name | Protein content (%) | Ash content (%) |
| T45 | 9 ca. | >0.5 |
| T55 | 11 ca. | 0.5-0.6 |
| T65 | 12 ca. | 0.62-0.75 |
| T80 | 14. ca. | 0.75-0.9 |
| T110 | 15 ca. | 1-1.2 |
| T130 | 16 ca. | 1.2-1.4 |
| T150 | 13 ca. | >1.4 |
Germany 🇩🇪
| Name | Protein content (%) | Ash content (%) |
| T405 | 9 ca. | <0.5 |
| T550 | 11 ca. | 0.51-0.63 |
| T812 | 14. ca. | 0.64-0.9 |
| T1050 | 15 ca. | 0.9-1.2 |
| T1600 | 13 ca. | 1.21-1.8 |
India 🇮🇳
| Name | Protein content (%) | Ash content (%) |
| Maida | 11 ca. | >0.5 |
| Atta | 13 ca. | 1.21-1.8 |
Italy 🇮🇹/San Marino 🇸🇲/Vatican City 🇻🇦
| Name | Protein content (%) | Ash content (%) |
| Type 00 | 9 | 0.55 |
| Type 0 | 11 | 0.65 |
| Type 1 | 12 | 0.8 |
| Type 2 | 12. | 0.95 |
| Integrale | 12 | 1.3-1.7 |
Japan 🇯🇵
| Name | Protein content (%) | Ash content (%) |
| 薄力粉 (Hakurikiko) | 9 ca. | 0.4 ca. |
| 中力粉 (Churikiko) | 11 ca. | 0.55 ca. |
| 強力粉 (Kyorikiko) | 14. ca. | 0.8 ca. |
| 強力末粉 (Kyorikimatsufun) | 15 ca. | 1.1 ca. |
| 全粒粉 (Zenryufun) | 13 ca. | >1.5 |
Poland 🇵🇱
| Name | Protein content (%) | Ash content (%) |
| T450 | 9 ca. | <0.5 |
| T500 | 10 ca. | 0.51-0.55 |
| T550 | 11 ca. | 0.51-0.58 |
| T650 | 12 ca. | 0.59-0.69 |
| T750 | 14 ca. | 0.7-0.79 |
| T1050 | 15 ca. | 0.79-1.2 |
| T1400 | 16 ca. | 1.21-1.6 |
| T1850 | 13 ca. | >1.6-2 |
| T2000 | 15 ca. | >2 |
South Africa 🇿🇦
| Nome | Protein content (%) | Ash content (%) |
| Cake flour | 5-8 | 0.3 ca. |
| Bread flour | 12-14 | 0.8 ca. |
| Nutty wheat flour | 13 ca. | >1.5 |
Switzerland 🇨🇭/Liechtenstein 🇱🇮
| Name | Protein content (%) | Ash content (%) |
| Weissmehl T400 | 9 ca. | <0.5 |
| Weissmehl T550 | 11 ca. | 0.5-0.63 |
| Halbweissmehl T720 | 14 ca. | 0.64-0.9 |
| Ruchmehl T1100 | 15 ca. | 0.91-1.6 |
| Vollkornmehl T1900 | 13 ca. | >1.7 |
United Kingdoms 🇬🇧/Ireland 🇮🇪
| Nome | Protein content (%) | Ash content (%) |
| Soft / Patent | 9 ca. | 0.4 ca. |
| Plain / White | 11 ca. | 0.55 ca. |
| Hard / Strong Bread / Lightbrown | 14. ca. | 0.8 ca. |
| Very hard / Very Strong Bread / Brown | 15 ca. | 1.1 ca. |
| Wholemeal | 13 ca. | >1.5 |
United States of America 🇺🇸
| Name | Protein content (%) | Ash content (%) |
| Cake flour | 5-8 | 0.3 ca. |
| Pastry flour | 8-9 | 0.4 ca. |
| All purpose flour | 10-12 | 0.55 ca. |
| Bread flour | 12-14 | 0.8 ca. |
| Hard flour / High gluten flour | 14-16 | 1.1 ca. |
| Whole Wheat | 13 ca. | >1.5 |
Nutritional facts table
Since the nutritional values of soft wheat flour vary depending on the specific type considered, we have chosen to provide those of American all-purpose flour.
| Nutrients | Per 100 g |
| Calories (kcal) | 364 |
| Total fat (g) | 1 |
| ———Saturated fat (g) | 0.15 |
| Cholesterol (mg) | 0 |
| Sodium (mg) | 2 |
| Total carbohydrates (g) | 76.3 |
| ———Dietary fiber (g) | 2.7 |
| ———Total sugar (g) | 0.3 |
| Protein (g) | 10.3 |
Recipes that use this product as an ingredient:
Source(s):
https://it.wikipedia.org/wiki/Farina
https://en.wikipedia.org/wiki/Flour
Photo(s):
1. Mudd1, CC BY-SA 3.0 https://creativecommons.org/licenses/by-sa/3.0, via Wikimedia Commons
2. Veganbaking.net from USA, CC BY-SA 2.0 <https://creativecommons.org/licenses/by-sa/2.0>, via Wikimedia Commons
3. National Archaeological Museum of Naples, Public domain, via Wikimedia Commons
4. Anne‑Sophie Schou Jødal, Kim Lambertsen Larsen, CC BY 4.0 https://creativecommons.org/licenses/by/4.0, via Wikimedia Commons